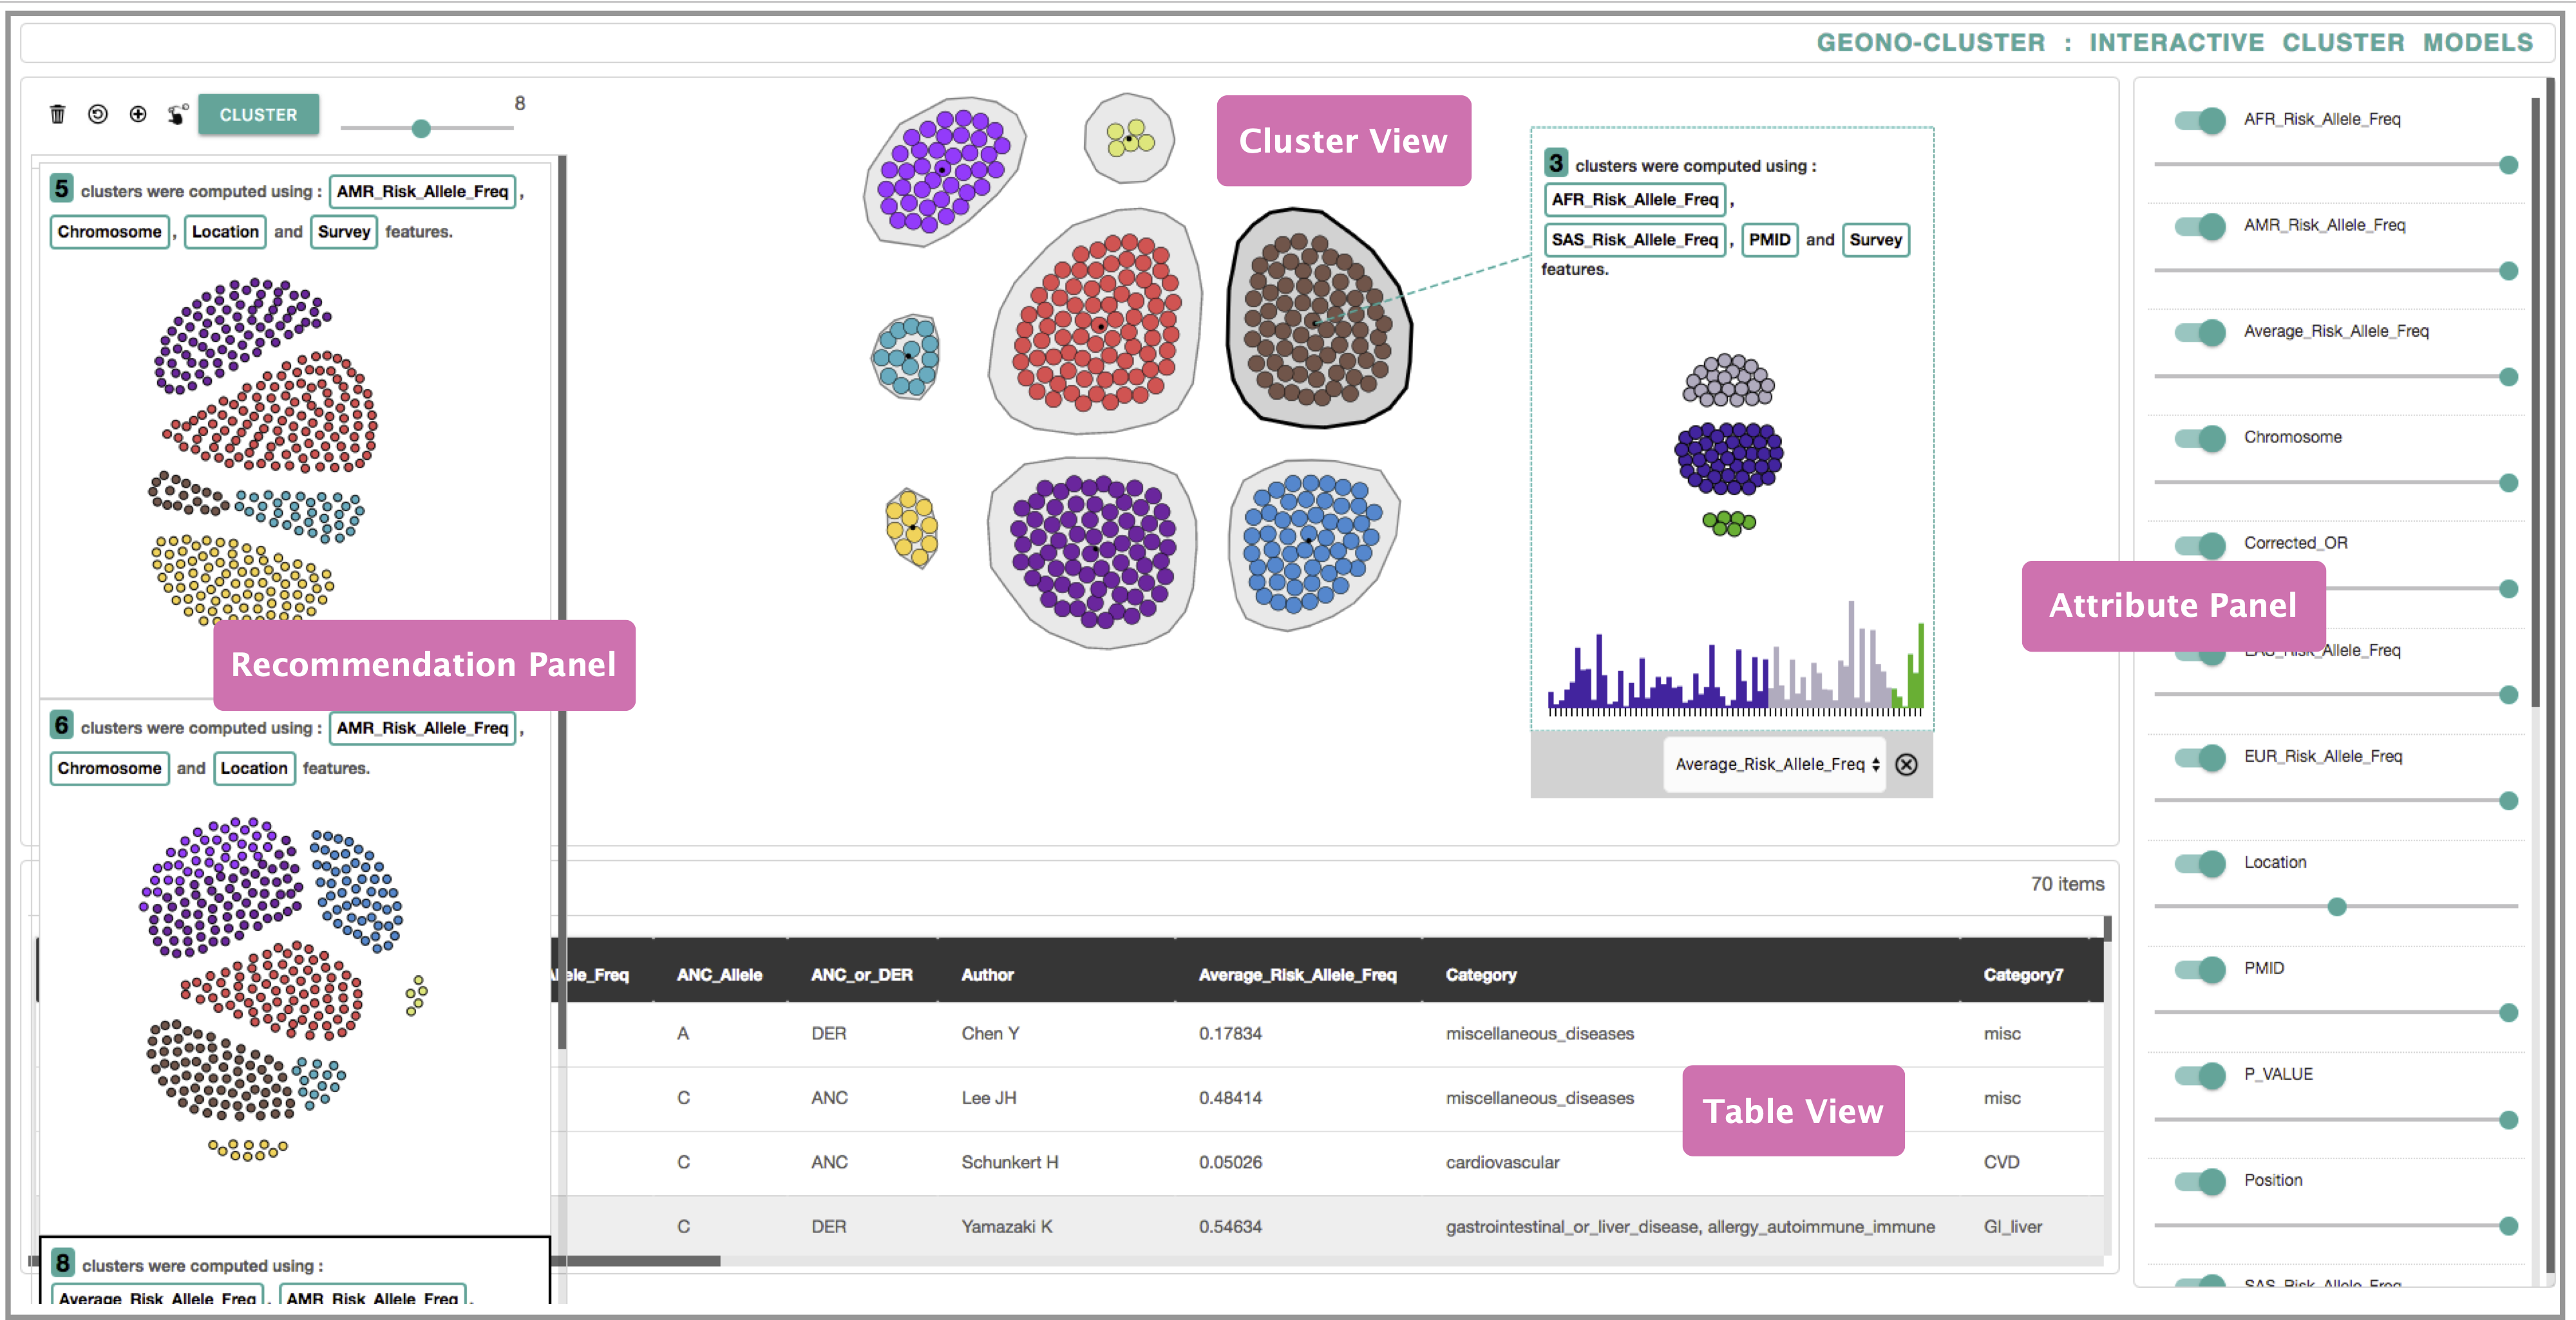
 Geono-Cluster allows users to interactively build, refine, and evaluate clustering from multidimensional data. Geono-Cluster consists of Cluster View, Recommendation Panel, Table View, and Attribute Panel.
Abstract
Biologists often perform clustering analysis to derive meaningful patterns, relationships, and structures from data instances and attributes. Though clustering plays a pivotal role in biologists' data exploration, it takes non-trivial efforts for biologists to find the best grouping in their data using existing tools. Visual cluster analysis is currently performed either programmatically or through menus and dialogues in many tools, which require parameter adjustments over several steps of trial-and-error. In this paper, we introduce Geono-Cluster, a novel visual analysis tool designed to support cluster analysis for biologists who do not have formal data science training. Geono-Cluster enables biologists to apply their domain expertise into clustering results by visually demonstrating how their expected clustering outputs should look like with a small sample of data instances. The system then predicts users' intentions and generates potential clustering results. Our study follows the design study protocol to derive biologists' tasks and requirements, design the system, and evaluate the system with experts on their own dataset. Results of our study with six biologists provide initial evidence that Geono-Cluster enables biologists to create, refine, and evaluate clustering results to effectively analyze their data and gain data-driven insights. At the end, we discuss lessons learned and the implications of our study.