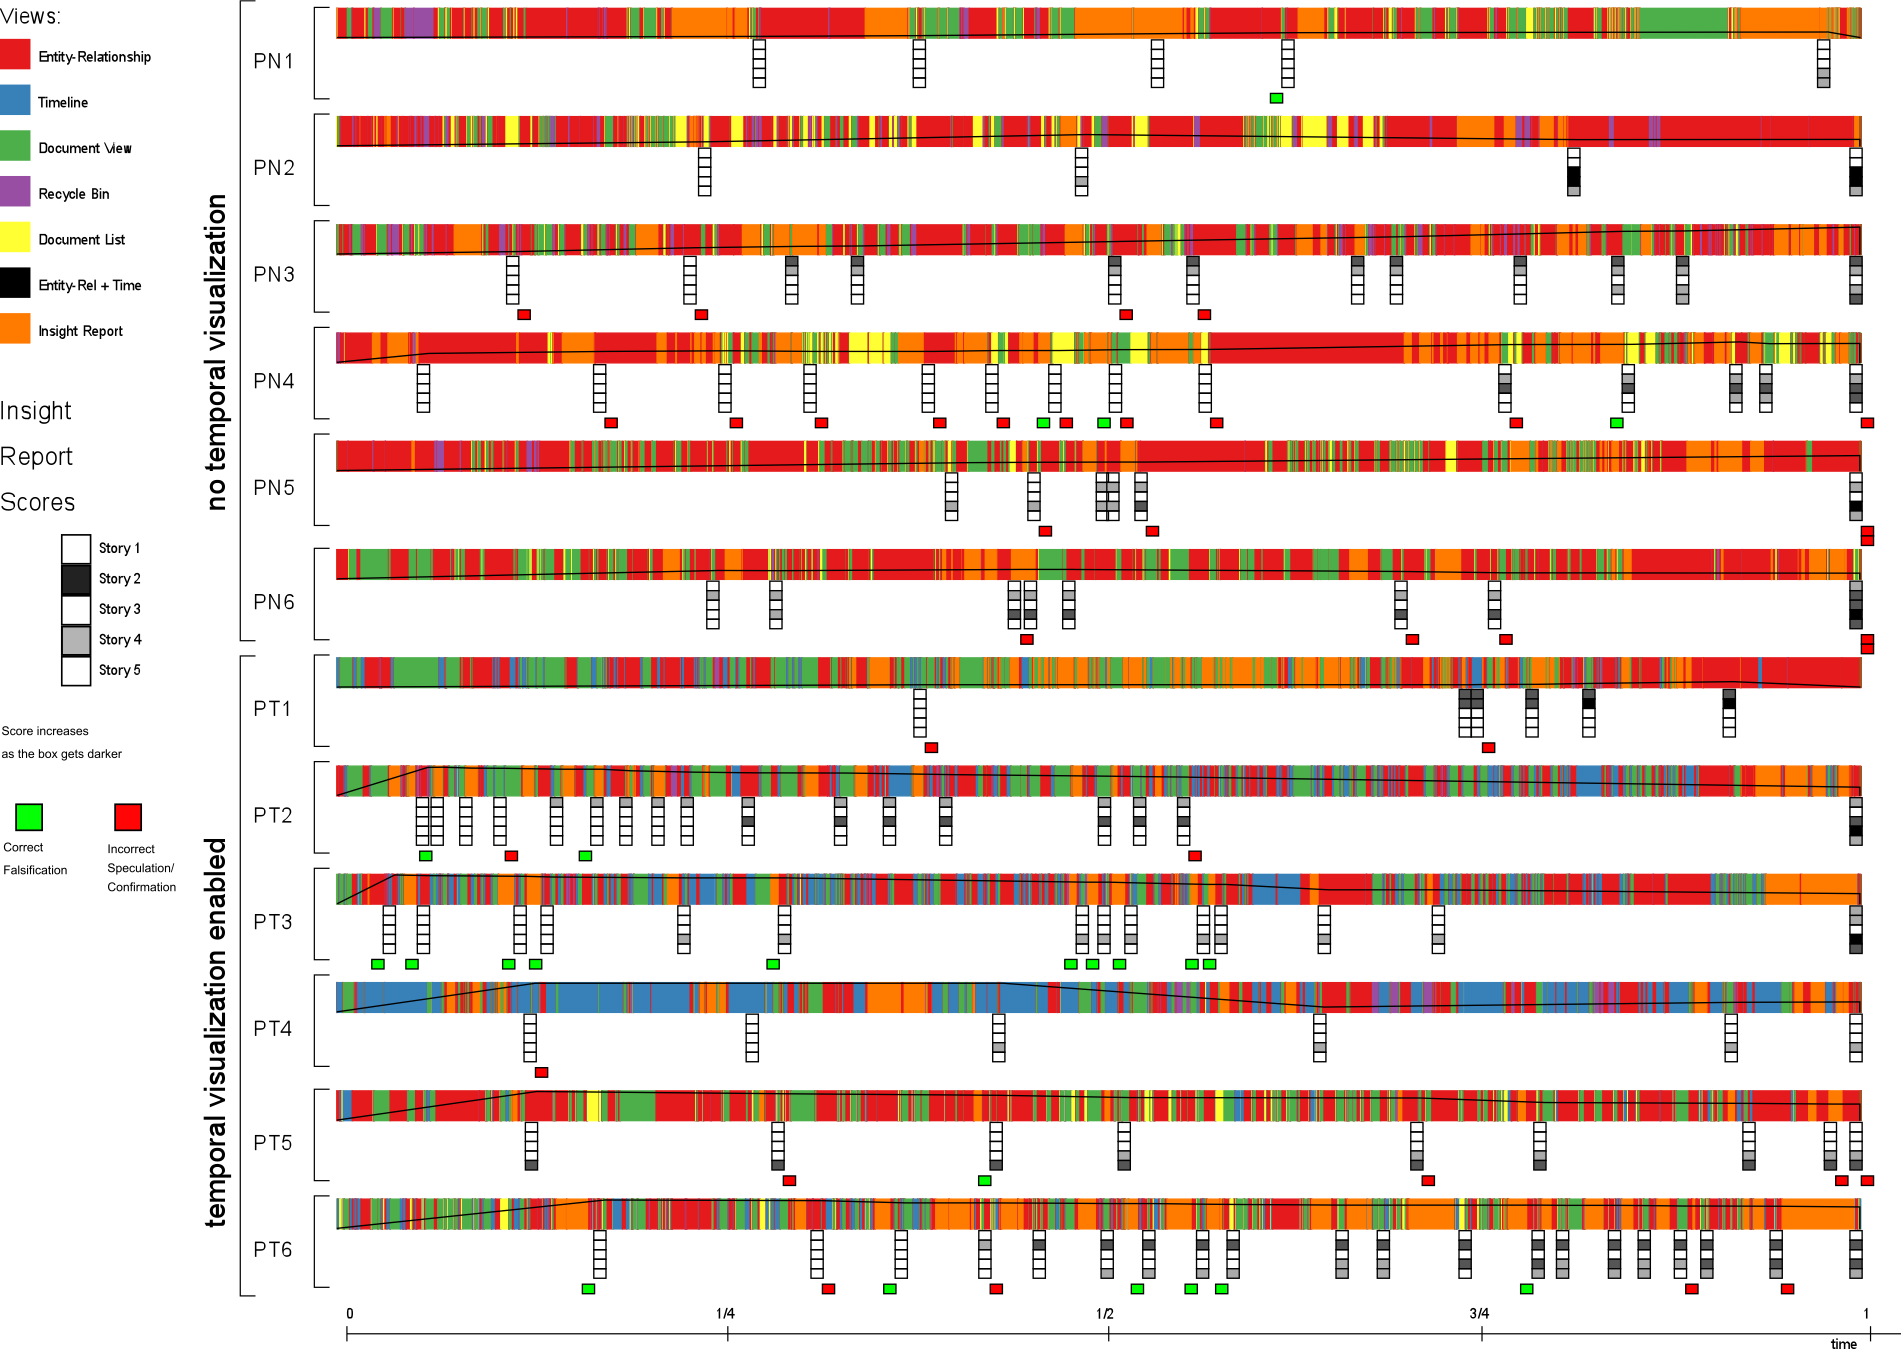
 Visualization of activities from 12 participants’ session in our user study.
Abstract
Time is a universal and essential aspect of data in any investigative analysis. It helps analysts establish causality, build storylines from evidence, and reject infeasible hypotheses. For this reason, many investigative analysis tools provide visual representations designed for making sense of temporal data. However, the field of visual analytics still needs more evidence explaining how temporal visualization actually aids the analysis process, as well as design recommendations for how to build these visualizations. To fill this gap, we conducted an insight-based qualitative study to investigate the influence of temporal visualization on investigative analysis. We found that visualizing temporal information helped participants externalize chains of events. Another contribution of our work is the lightweight evaluation approach used to collect, visualize, and analyze insight.